Sunday 3 September 2017

Urbanisation of Asansol - Part 5

This post has been divided into five parts:
Chapter 6

Conclusion


6.1 Introduction

In this study an attempt has been made to examine the interaction between spatial and economic changes in the process of urbanisation in Asansol region with a focus on Asansol city. The account of Asansol so far delineated practically sought to apply the different theories of urbanisation to a specific city and its neighbouring region. To understand the dynamics and evolutionary path of urban development, we tried to integrate the components from the different theories of urban spatial structures like the analysis of capital accumulation and urbanisation of capital, theories of growth-pole and the urban hierarchy exploring the regional pattern of urbanisation and the location theories of urban structure determining the locations of firms and households in a modern city.

These theories provided a very useful framework for interpreting the spatial and economic changes in Asansol. They identified some of the dynamics responsible for the urbanisation of the space in which Asansol is situated. As we have discussed in chapter 2, these theories were based on some very important assumptions. They, however seems to have overlooked some other significant aspects of spatial and economic changes. For example, they did not take into account the historical perspective of a region and the topographical feature and the environmental factors of the same. A theoretical structure is an abstract version of the real one. So it has its limitations. An urban space cannot be a specific enclosed area separated from the larger world. It is an open space which is linked with the rest of the world.  So, there are a number of forces which operate on it and determine the dynamics of the spatio- economic relationship in an urban area.

To bridge the gap between theoretical understanding of spatial and economic changes in a city, we have turned to empirical studies on Asansol during the post-independence period. An account of the pre-independence period has served as its background.

While the above is an overview of the study, the rest of the concluding chapter will summarise in section 6.2 the main findings of the study.  Section 6.3 will discuss the issues responsible for making Asansol Region an eco- efficient space for urban capital flow. Sections 6.4 and 6.5 will dwell on the implications of the study and the scope for further research.

6.2 Summary of the Main Findings
   
The main findings of this study are summarised as follows:

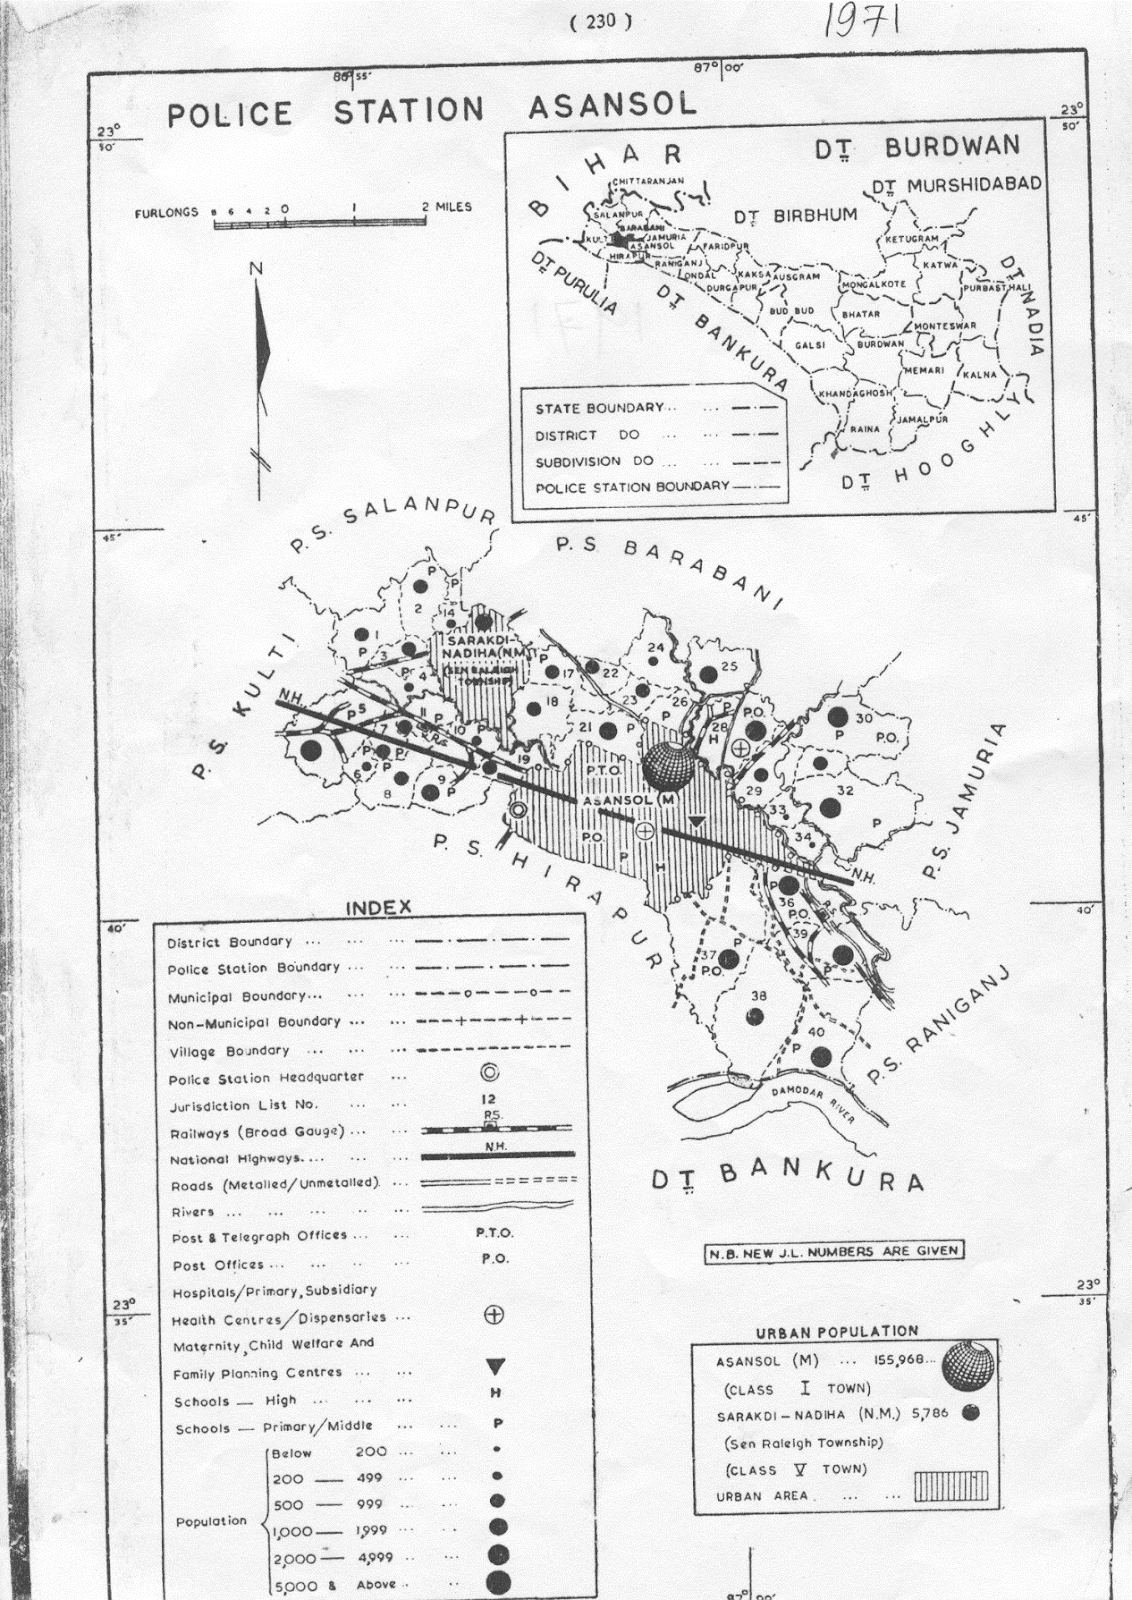
(i) A hierarchy of urban settlement was created in Asansol region based on coal, transport network, steel and the linkage industries since the colonial period. The inflow of capital in coal here transformed the unorganised space to a busy mining based industrial urban agglomeration. Raniganj, Asansol, Kulti, Burnpur gradually turned to urban areas. But in the pre independence period, the development was the outcome of the interest of the foreign capital owners, native princely rulers and the big zamindar class. They invested in this mining belt for extraction of the surplus .Their objective was not welfare maximisation of the general masses but fulfilling their own profit maximisation objective. The region generated localisation and urbanisation economies which continued in the post independence period also.

(ii) In the post independence era, the nature of the welfare maximising public sector industrialisation programmes played a very important role in producing new industrial-urban space and altered the urban hierarchical structure in this region. Some towns were the outcome of planned investment, some were spontaneous. Chittaranjan, Durgapur and Hindusthan Cables Town were product of public investment whereas Sarakdi-Nadiha (Sen Raleigh Township) and Jemari (J.K.Nagar Township) were the outcome of private investment. Niamatpur, Ukhra, Jamuria (1961) and Dishergarh got the status of town due to increase in population and expansion of mining activities. The urban growth of this region is a combined impact of emergence and growth of some new towns as well as the increase in population of the existing towns. The position of Asansol and Burnpur changed after the formation of Durgapur. Durgapur emerged as the largest city in 1971. Similarly Chittaranjan came ahead of Kulti. The economic activities of the different towns in this region also complemented the needs of one another and enriched the industrial growth initially. Due to major public sector multi industrial investment in this region, private investments in small and medium industries also flowed in the towns like Asansol, Durgapur and Raniganj here. Coal, steel, engineering and chemical units were the core activities. Moreover, the industrial structure of these towns got diversified with a series of linked industries viz the ancillary industries and the mineral based industries having either forward or backward linkages with the core sectors. The region built up market linkages with the other resource rich neighbour states due to its strategic location and well developed transport network.

(iii) The nationalisation of coal and other basic and heavy industries during the seventies of the late century brought about a big change in the Asansol region. The positive employment policy of the Government expanded the service sector. There had been a notable rise in wage structure just after nationalisation. The overall level of urbanisation was very high in this region due to the emergence of this large number of urban centres where mining was the dominant activity in 1981 and 1991 though the growth of the existing towns decelerated. In- migration was considerably high. Nationalisation gave an impetus to the overall development in the employment and urbanisation of the Asansol region. The data of the socio- economic indicators like gender ratio, work participation rate, trade pattern also revealed that. The national economic policies had however, adversely affected the manufacturing industries. It shows that the correlation between production and urbanisation is not always positive.

(iv) In spite of the agglomeration economies, the region failed to exploit their advantages in the long run. Different emergent forces which are ignored by the existing regional urban growth theories, adversely affected the industrial growth here since the mid seventies of the late century. Among them   the national policies of freight equalisation and uniform sales price of pig iron and finished steel in all parts of the country blocked the locational advantages of this region for the industries like engineering, metal based and the related ones. Regarding transportation of coal, telescopic railway rates was followed so that the greater the distance to be covered, the less will be the average rate charged per ton mile. It reduced the locational advantage of heat intensive high coal consuming metal and chemical industries here.  Public sector industrial growth was also hampered by administrative and management problem. Moreover, stringent licensing policy, substitution of coal based chemical industry by petro based chemical industry along with the local labour problem affected the private industrialisation here. The decelerations in the coal and steel generated a phase of agglomeration diseconomies here.

(v) The reputed urban centres like Asansol, Raniganj, Chittaranjan and Durgapur experienced a slow rate of growth in the seventies as compared to the 60’s. However the rate of urbanisation in Asansol and Hindusthan Cables Town increased during the 80’s.

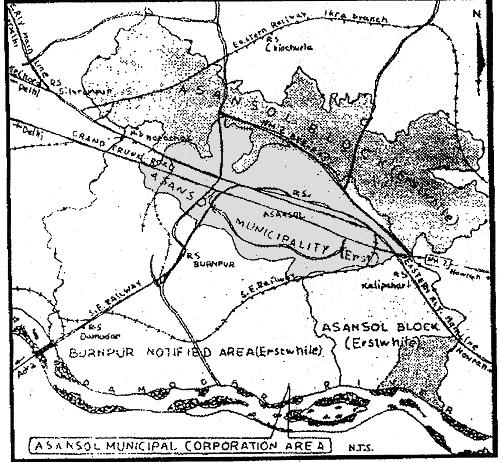
(vi) In the first decade of the post liberalised era, there has been a shift in the pattern of urban growth in this region.  This population growth was magnified in the towns like Jamuria, Kulti, Raniganj and Asansol as all of them experienced spatial expansion. They have incorporated some adjacent urban and rural areas. The urban status of Jamuria, Kulti and Asansol also changed. Among these towns, Jamuria occupied upper position than Raniganj in the urban hierarchical structure. Jamuria incorporated a large number of mining based manufacturing towns. Moreover, many small towns which acquired the status of new towns during the earlier two decades were merged into some of these towns. The spatial jurisdiction of the post independent public sector manufacturing towns Durgapur, Hindusthan Cables Town and Chittaranjan remain unchanged. They experienced either stagnant or negative rate of population growth.

(vii) The period 1991-2001 saw the gradual slowing of large scale industrial activities and mining. The shift of the government economic policy from welfare maximisation to liberalisation and privatisation resulted in the closure of many sick industrial units during this period. Small scale units started to proliferate by the end of the 90’s which suffered in the earlier decades due to strict government control over their raw materials.  

(viii) The employment policy of the Government changed which resulted in the reduction of the percentage of main workers and increase of marginal workers. The need for skilled workers shot up to compete with global production. The rise of proportion of marginal worker substantiates the fact that the Government did not hire these skilled workers all the times but gave sub contract to the private sector whose employment policy was not made public.

(viii)The comparisons of the socio- economic indicators of the field based study with an earlier survey and with their respective CD Blocks reveal that the public sector industrial led urbanisation in this region had considerably benefited the employees of the nationalised sectors but it did not percolate evenly to the whole local economy. Thus public sector injected money but they were unable to boost up local economy.

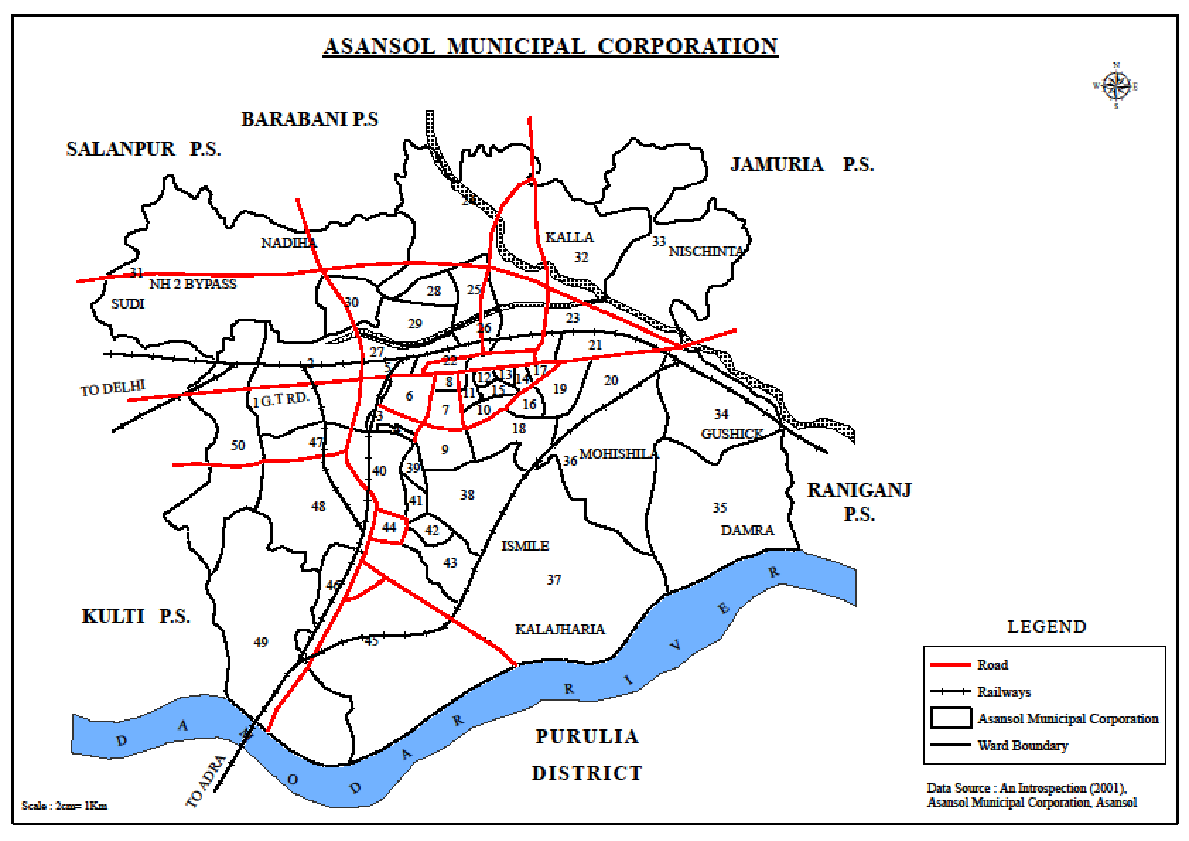
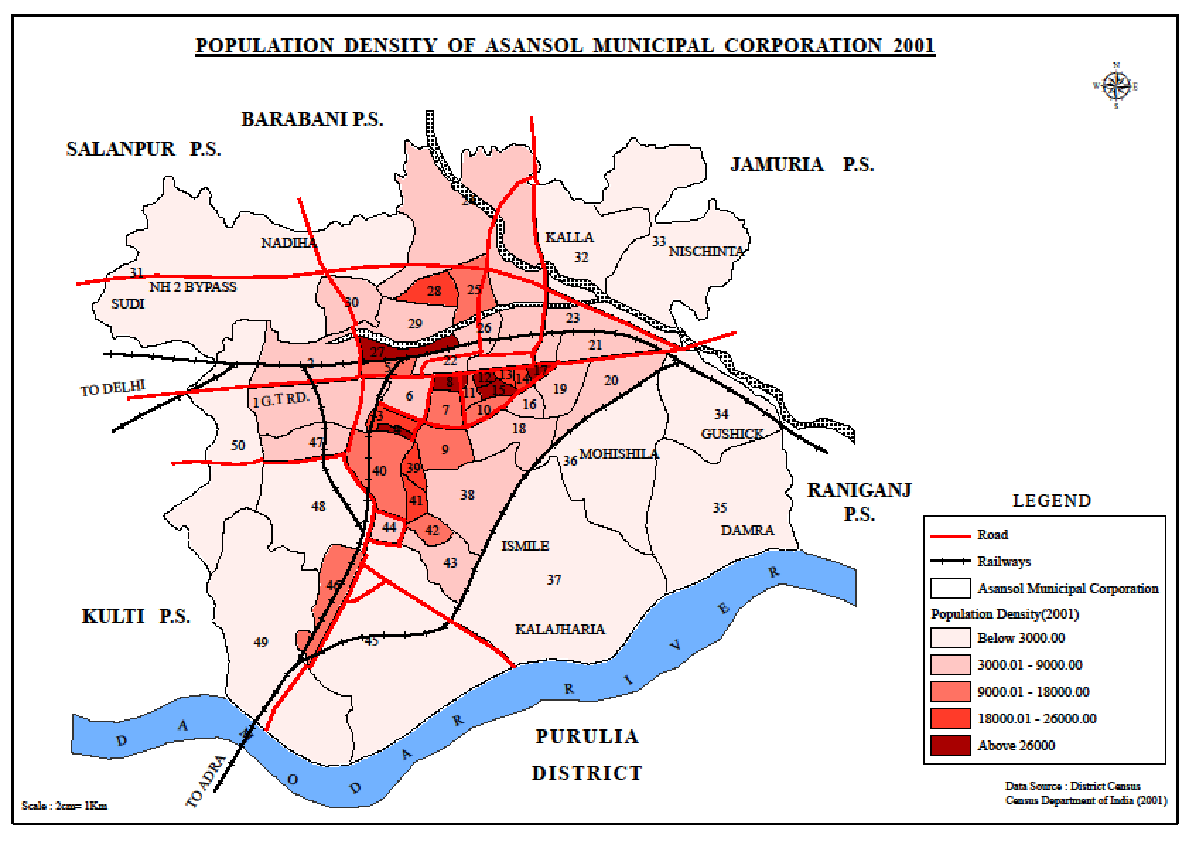
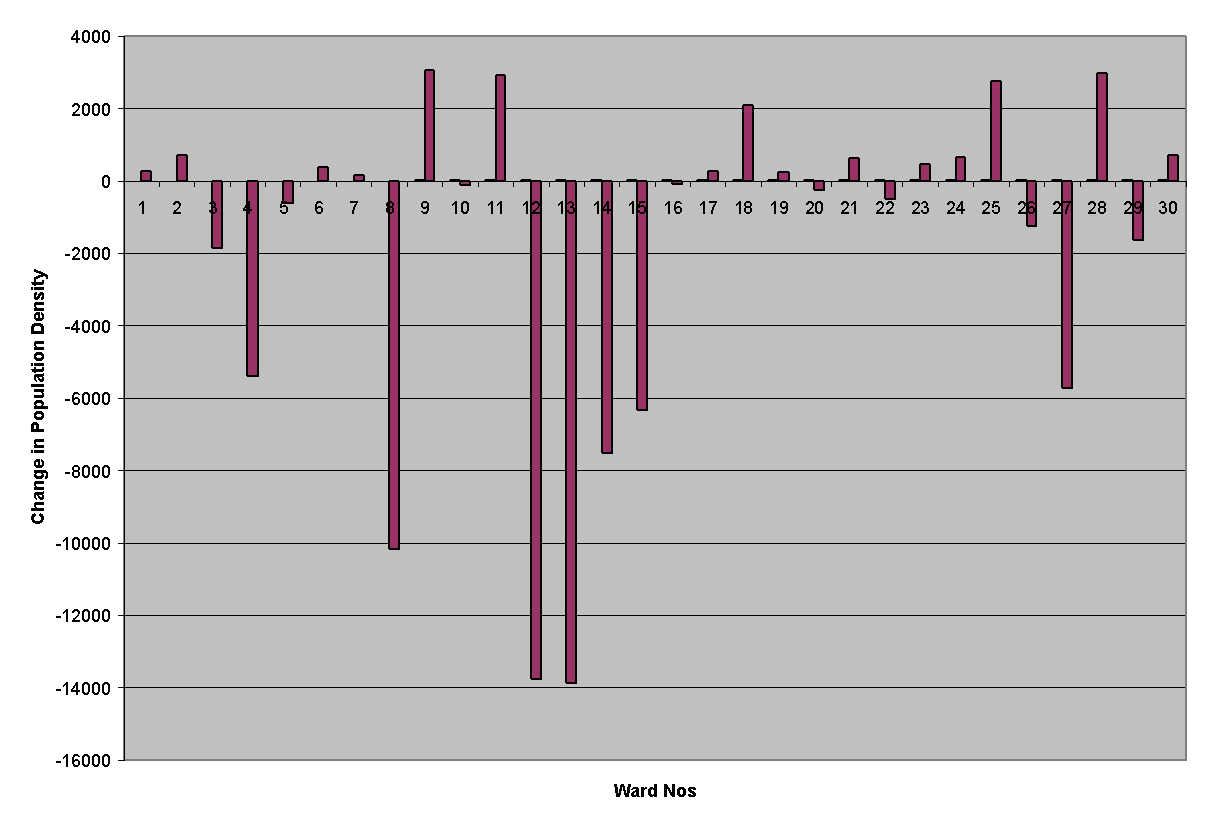
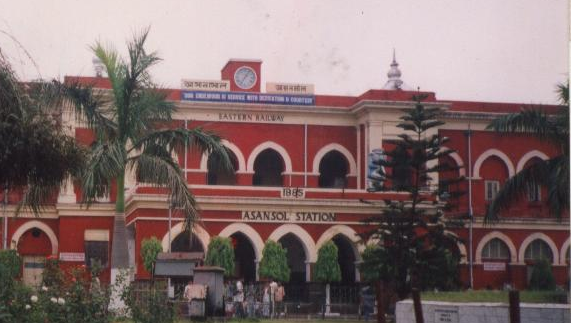
(ix) Though the Asansol region as a whole failed to exploit the advantages of agglomeration economies but in the inner city they played an affirmative role. In 1951, non residential business activities were concentrated around the then city centre comprised of the neighbourhood of the railway station in the north of the Grand Trunk Road and the market in the south of the this road. Absence of suitable routes connecting the other areas initially made these locations adjacent to the rail station and along the Grand Trunk Road the most valuable. They offered the advantage of low transport cost, greater accessibility to the input market, and a greater range of economies of scale. The rapid rise of residents in the city over time changed the structural composition of the ward. The city turned bigger during these twenty years. As the Grand Trunk road is also parallel to the rail route, the residential population densities were higher adjacent to the road. Residential population density was low near the rail station because it was the CBD area there were built spaces owned by railway authority for administrative set up and service quarters. The population density increased initially at a distance from the rail station and the CBD area. As in the earlier decades, there was lack of adequate built infrastructural development in road and transport network in the areas away from the G.T. Road. The expansion of the city over time was along the two sides of the G.T. Road. The spill over of the urban population was due to the reason that land was not available or too expensive near the G.T. Road or the CBD area. Transport network evolved and sub centres were created to cater the various needs of the residential population. The city gradually turned from a mono-centric to a multi-centric one over the period of fifty years.  The small scale manufacturing units were concentrated in some wards to gain the benefit of external economies of some sort. Residential population density was high in the areas where non basic activities were available. Vertical space in the form of multi storied apartment was built in some of the old thirty wards.  

(x) The spatio economic character of the newly added wards was different from the old wards. Vertical space for general population was not developed there because a large part of the land there was owned by IISCO and ECL authorities. There were residential family quarters for the middle and high income group employees where intensity of space uses were considerably high.  Some of these wards were agricultural and mining areas. A few were tribal inhabited areas with few urban amenities. Thus residential population density was lesser than the old thirty wards.

(xi) The empirical findings reveal that population density changes in Asansol in 1991-2001 is influenced by the  physical accessibility in the form of rail and roadways, gender ratio, literacy rate of female population and the location of the wards in the northern or the southern part of the G.T. Road.  Thus residential location patterns in the different wards of the Asansol city is influenced by a co ordination of socio-economic, demographic, geographical and historical factors.

(xii) The construction of NH2 Bypass and the inflow of capital in the tertiary sectors like private technical education institutes after the set back of manufacturing sectors helped in the emergence of new sub centres especially in the northern fringe area. The availability of land helped in the expansion of increasing residential population density adjacent to it.

(xiii) The region is gradually turning to a vulnerable one due to growing incidence of land subsidence, underground fire and other environmental hazards. Moreover, illegal mining due to lack of alternative employment opportunities and laxity of the administration aggravated the problem of subsidence. Surplus creation continued but it does not add to real productivity.

(xiv) It logically therefore follows that the internalisation of the surplus that has been created is utmost necessary to rejuvenate Asansol. The positive role of economic agents is the exigency of the hour for a holistic infrastructure creation.


6.3 Issues Responsible for Making Asansol region An Eco-Efficient Space for Urban Production

As we have mentioned, the process of industrialisation led urbanisation here unavoidably produced ‘unintended consequences’ and created some ‘unwanted effects’. The region and the city are gradually becoming ecologically unsustainable due to land subsidence. In 2007, an action plan for shifting and rehabilitation from unsafe areas, dealing with fires and stabilising unstable areas under the command of ECL has been drawn up. CMPDIL, Asansol is entrusted with the responsibility of the Master Plan (Annual Report CIL 2006-07). Asansol region is also suffering from severe level of pollution in the environment components like air, water and land (Central Pollution Control Board, 2009). The local bodies here already realised this problem and Action Plans have been prepared to control the pollution in the area (ADDA City Development Plan 2006).

The study of Asansol shows that the spatio- economic changes are a composite combination of a various quantitative and qualitative socio- economic, geographical, historical, demographic and ecological factors. Thus communication and awareness among all concerned can strengthen a local economy in the near future and sustain the growth of any city.  

6.4 Implications of the Study

Any case study of urbanisation logically throws light on the existing urban growth theories. This study analyses how industrialisation and the circulation of urban capital go together. In other words wherever there is prospect of industrialisation, there is urban capital to materialise those prospects. Thus the circulation of capital transforms an entire region into an urban space. However, investment being dependent on locational factors as well remains scattered in the region leading to an urban hierarchical structure. Thus urban hierarchy can be explained by the location theory.  In this context, if we look into a city within an urban region we can find intra- city urban hierarchy as well. Therefore in our opinion the theories of urbanisation of capital, urban hierarchy and urban location theories must be studied in an integrated form for analysing the spatial and economic changes in a city.
6.5 Scope for Further Research

Ours has been rather an attempt at the application of a few general theories on urbanisation as noted above to understand the dynamics of the city of Asansol. But other components could be also there to any urban growth or deceleration. They might be accidental ones such as land subsidence, destruction of environment and so on. We have discussed that Asansol region being a mining based industrial one is faced with recurrent land subsidence, underground fire, pollution, water crisis and loss of fertility of agricultural land. They surely need special attention from scholars on humanitarian ground and in the interest of economic prosperity of our country.

Bibliography


Ahluwalia, Isher J (1985). Industrial Growth in India: Stagnation since the Mid-Sixties, Delhi, Oxford University Press.
Alonso, W (1964). Location and Land Use, Cambridge, Harvard University Press.
Asansol Durgapur Development Authority (1989). Survey of Shops and Establishments in the Central business District Area, Asansol.
Asansol Durgapur Development Authority (1992). An Information Bulletin on Asansol and Durgapur Sub- Division , Asansol.
Asansol Durgapur Development Authority (1993). G.T.Road Encroachment: Survey Report ( Barakar to Bud-Bud) , Asansol.
Asansol Durgapur Development Authority (2001). Socio-Economic and Demographic Profile of People in the Asansol-Durgapur Planning Area 2000-01, Asansol.
Asansol Durgapur Development Authority (2006). City Development Plan, Asansol Urban Area, Web Edition.
Asansol Municipal Corporation (2001). An Introspection, Asansol.
Asansol Planning Organisation (1977). Key Statistics of the Asansol Planning Organisation, Asansol.
Asansol Planning Organisation (1977). Report on Housing Conditions in Asansol Municipality and in Durgapur Notified Area: the estimate for future housing needs, Asansol.
Asansol Planning Organisation (1977). Report on Industrial Situations in Asansol Planning Region, 1951-1975, Asansol.
Asansol Planning Organisation (1978). Socio- Economic Survey in the Kasai Mohalla and Jhingri Mohalla of the Asansol Municipality, Asansol.
Asansol Planning Organisation (1978). Sub Plan for the Tribal Areas of Burdwan,Tribal Development Project No 31 and 32, Asansol.
Asansol Planning Organisation (1981). Report on Industrial Situations in Asansol Planning Region, 1951-1975, Asansol.
Bagchi, Amiya Kumar (1972). Private Investment in India 1900-1939, Cambridge, Cambridge University Press.
Bandyopadhyay, Santimoy (2005). Asansol Parikrama:History of Asansol Sub Division about Five Hundred Years, Asansol, Trinity Trust. (In Bengali)
Basak, Nandita (2000). Dynamics of Growth Regional Perspective: Experience of Five Indian Industrial Towns 1961-1999, Calcutta, Firma KLM Private Ltd.
Biswas, K.R [State Editor]( 1994). West Bengal District Gazetteers: Barddhaman, Kolkata, Education Department, Government of West Bengal.
Black, John (1997). Oxford Directory of Economics, Oxford, Oxford University Press.
Boudeville, J (1966). Problems of Regional Economic Planning ,Edinburgh
University Press, Edinburgh.
Brown, Lester R (2001). Eco- Economy, U.K, Earthscan Publications Ltd.
Burgess, E.W (1925). The city, Chicago, University of Chicago Press.
Chakraborty, Jharna (1998). Evolution Of Asansol- Durgapur Industrial Complex and Its Impact On Regional Economy, Thesis submitted for the Degree of Doctor of Philosophy in Geography, Calcutta, Department of Geography, University of Calcutta.
Chatterjee, Mahalaya and Giri, Pabitra (Aug 2001). Functional Classification of Urban Areas in India, Urban Database Series No.1, Kolkata, Centre for Urban Economic Studies, University of Calcutta.
Coal India Limited (2005-06 &2006-07). Annual Reports, Web Edition.
Comprehensive Environmental Assessment of Industrial Clusters (Dec 2009), Central Pollution Control Board, Delhi, Ministry of Environment and Forests, Web Edition.
Course Material Module 1 (2010), Urbanisation and Urban Development, CUES, University of Calcutta, Kolkata
Das Gupta, Ranajit (1985). Migrants in Coal Mines: Peasants Proletarians, 1850s-1947, Social Scientist, Vol13, No12.
Dasgupta , Biplab [ed] (1988). Urbanization, Migration and Rural Change A Study of West Bengal, Calcutta, A. Mukherjee & Co. Pvt Ltd.
Datta, L.N (2000). The West Bengal Municipal Act, 1993 (W.B. Act XXII of 1993), Calcutta, Tax’ N Law.
Census of India !951, West Bengal, Burdwan District Census Handbook .
Census of India 1961, West Bengal, Burdwan District Census Handbook, Vol- II
Census of India 1971, Series 22, West Bengal, District Census Handbook, Parts X-A & X-B.
Census of India 1981, Series 23, West Bengal, District Census Handbook, Burdwan District. Parts XIII-A and XIII-B.
Census of India 1991, Series 26, West Bengal, District Census Handbook, Barddhaman District . Parts XIII-A and XIII-B.
Census of India 2001, West Bengal, District Census Handbook, Barddhaman District, CD Format.
Census of India (2001), Final Population Totals, Table-1, 3, 4  
Census of India (2001), Series 20, Provisional Population Totals, Paper-2 of 2001, Pg T-97.
Dutta, Sumana (2003). Impact Of Environmental Problem On Land Use Of Ajay Damodar Interfluve; Asansol Sub-Division, Thesis submitted for the Degree of Doctor of Philosophy in Geography, Calcutta, Department of Geography, University of Calcutta.
Evans, Alan .W (1985). Urban Economics: An Introduction, Oxford UK &Cambridge
USA, Blackwell, pp 65-77.
Ganguly, D.S (1979). Regional Economy of West Bengal: A Study of Urbanisation, Growth Potential & Optimisation of Industrial Locations, Calcutta, Orient Longman Ltd.  
Ghosh, Mausumi (2007). “Asansol er Nagarayan - Urbanisation in Asansol” in Mukhopadhyaya, Ramesh Chandra [ed], Nagarayan, Kolkata, Underground Literature (In Bengali).
Giri, Pabitra (1998). “An Analysis Of The Growth Of Small And Medium towns In West Bengal, 1951-1981” in Dasgupta, Biplab[ed], Urbanization, Migration and Rural Change  A Study of West  Bengal, op.cit.
  Gottdiener, M and Budd, L (2005). Key Concepts in Urban Studies, London, Sage
Publications , pp 85-86.
Guha, Debjani (1996). Spatio- Temporal Growth Of Industrial Centres and Its Impact On Urbanisation In Asansol- Durgapur Area , Thesis submitted for the Degree of Doctor of Philosophy in Geography, Calcutta, Department of Geography, University of Calcutta.
Harris, C and Ullman, E (1959). “The Nature of Cities” in Mayer.H and Koln. C [eds], Readings in Urban Geography, Chicago, University of Chicago Press.
Harvey, David (1989). The Urban Experience, Oxford & Cambridge, Blackwell pp17-58.
Harvey, Jack (2000). Urban Land Economics, New York, Palgrave.
Hoyt, H (1939). The Structure and Growth of Residential Neighbourhoods in American Cities, Washington DC, FHA.
Hudson, Ray (2005). Economic Geographies, London, Sage Publications Ltd.
Hurd, R.M (1924). Principles of City Land Values, New York, The Record and Guide.
Jha L.K. (1975). “The concept of mixed economy” in Dutt, R.C.and Nigam, Raj.K[eds] ,Towards commanding Heights, New Delhi, SCOPE.
Kumaramangalam, S. Mohan (1975). “New model for governmental administration of industry” in Dutt, R.C.and Nigam, Raj.K. [eds]. Towards commanding Heights, op. cit.
Lahiri-Dutt, Kuntala (2001). Mining and Urbanization in the Raniganj Coalbelt, Calcutta, The World press Private Limited.
Lal, H (1987). City and Urban Fringe, A Case Study of Bareilly, New Delhi, Concept Publication.
Macdougall, J (1965). Ancillary industries in Asansol- Durgapur: A Preliminary Survey, published for Institute of Public Administration, New York, Asia Publishing house.
Majumdar, Ramesh Chandra (1975). Bangla desher Itihas (History of Bengal), 4th vol, Kolkata, General Printers and Publishers Pvt Ltd. (In Bengali)
Mitra, A. and Prakash, Sachdev Ram (1980). Population and Area of Cities, Towns and Urban Agglomerations, 1872-1971, New Delhi, Allied Publishers Pvt Ltd.
Mukherjee, Hena (1994). The Early History of the East Indian Railway 1845-1879, Calcutta, Firma KLM Ltd.
Mukherjee, N. and Banerjee, R (Dec 2003). Privatisation of Coal Industry: A Review Udyog, Special Number, Asansol, West Bengal.
Mukhopadhyaya, Ramesh Chandra (2004). The Story of a College, Kolkata, Underground Literature, pp 12-13.
Munshi, Sunil Kumar ( 1980). Geography of Transportation in Eastern India under the British Raj, Centre for Studies in Social Sciences, Monograph No. 1, Calcutta, K.P. Bagchi and Co.
Nayak, Dinabandhu (2005). Sripur Village the Bower of Wealth, Kol, Underground Literature.
Parikh S.S [ed] (1977). Coal after Nationalisation, Calcutta, C.C.A.I Publication, p. 202.
Paterson, J.C.K (1910). Bengal District Gazetteers: Burdwan, Calcutta, Bengal Secretariat Book Depot.
Paul, Sudipta (2006). A Report on Condition of Workers in Asansol (http:/mail.sarai.net/pipermail/reader-list/2006-April/007264.html).
Perroux, F(1970). “Note on concept of Growth Poles” in D.L., Mckee, R.D. Dean and W.H. Leahy [eds],Regional Economics, op.cit.
Raychaudhuri, Ajitava and Basu, Gautam Kumar Basu (June, 2007). “The Decline and Recent Resurgence of the Manufacturing Sector of West Bengal: Implication for Pro- Poor Growth from An Institutional Point of View”, Discussion Paper Series , Number Ten, IPPG Discussion Papers available at www. ippg.org.uk
Richardson, H (1973). Regional Growth Theory, London, Macmillan.
Richardson, H (1978). Regional and Urban Economics, Harmondsworth, Penguin Books, pp 165-171.
Rothermund, Dietmar (2000). An Economic History of India, 2nd Ed., London and New York, 1st published in 1988, Routledge.
Sengupta, Satyabata (2006). Chittaranjan : Past and Present, Unpublished seminar paper.
Sinha, N.K. (1968). The Economic History of Bengal, Vol-II, Calcutta, Firma K.L.M.
Soja, Edward (1989). Postmodern Geographies: The reassertion of Space in Critical Social Theory, London, Verso.
Sullivan , Arthur O (1996). Urban Economics , Chicago, IRWIN
The Centre for Urban Economic studies University of Calcutta and Australian National University (2007). Migration, Urbanisation and Women’s Status in the Raniganj Coalbelt, The report of a joint project.
The Energy and Resources Institute (October, 2005). “Accounting for unsustainable mineral extraction in Madhya Pradesh & West Bengal”, Draft Final Report TERI Prepared for CSO, Project Report No 2003 RD 62.
             And helpful   Web Resources


Urbanisation of Asansol - Part 4

This post has been divided into five parts:

Chapter 5


Spatial and Economic Changes in Asansol City, 1951-2001


5.1 Introduction

It has been already observed during 1951-2001, the towns and cities of the mining and manufacturing based Asansol region experienced significant spatial and economic changes due to major shifts in the national economic policy. Asansol, being its nerve centre naturally felt the impact. It gradually transformed itself from a class II town to a city. With the increase in population, the spatial area of the city expanded extensively in these fifty years. It is at present under the administration of Municipal Corporation, the highest local administrative body.


In this chapter we will study how these changes shaped the settlement pattern in Asansol during 1951-2001. For studying these spatio- economic changes, we consider the existing urban location theories discussed in Chapter 2 as our theoretical foundation.


Urban location theories assume that the competition for scarce land in any urban area is the main factor that influences the locational arrangement in a city. Thus the accurate information regarding the urban land use pattern seems to be an important component.  However, the problem here is that there is shortage of authentic and exhaustive statistical record regarding the rent pattern and the functional use of land. To override that problem, residential population density is chosen as a proxy variable for intensity of land use.  No doubt, the decision of the residents regarding their location to carry on their objectives reflects the nature of demand for the land in a city.
In view of that, we are studying the structural changes in the city mainly by considering the socio- economic characteristics of the residential population in the different wards of the city. Wards are the smallest politico- administrative units in a city and there are accessible census reports regarding their areas as well as economic and social characteristics which are useful for our analysis.


We have divided the long period of fifty years into three sub periods 1951-1971, 1971-1991 and 1991-2001 similar to our chapter 4. This chapter thus consists of four sections besides this introductory one. The next three sections 5.2, 5.3 and 5.4 analyse the spatial and economic changes during the above mentioned three periods. Some emergent features cropped up during these different periods. Accordingly a conceptual outline is also developed in the section 5.4 based on 1991-2001 data followed by its statistical analysis. Section 5.5 contains concluding remarks.


5.2 Spatial and Economic Changes in Asansol City during 1951-1971


Asansol was a mono centric town in 1951. The historical perspective of Asansol region in chapter 3 narrated earlier shows how the town evolved rapidly in the late nineteenth century because of rail transport. Since rail was the earliest high-speed mode of public transport there, all the main transport routes converged to the railway station and so the central business district was also located in its neighbourhood. It clearly shows that people gathered around the then city centre, which comprised of the railway station in the north of the Grand Trunk Road and the market in the south of the this road. Except that, absence of suitable routes connecting the other areas initially made land at the central locations adjacent to the rail station and along the Grand Trunk Road the most valuable. Such locations offered the advantage of low transport cost, greater accessibility to the input market, and a greater range of economies of scale. As the Grand Trunk road is also parallel to the rail route, the residential population densities were higher adjacent to the road. The municipality then consisted of seven wards. Asansol however was promoted from the status of a class II town to a city in 1961. It still consisted of seven wards. And its area was the same as in 1951; but the population density of the wards escalated. The Table 5.1 depicts the rise in population growth in the different wards.


Table 5.1
Ward Level Decadal Rate of Growth of Population in Asansol, 1951-1961
Ward Number
Decadal Rate of Growth of Population (%)
1
51.29
2
240.07
3
116.54
4
190.52
5
169.84
6
146.94
7
33.49
Source: Computed from the data of Census of India, District Census Handbook for Barddhaman 1951 and 1961.


Among the wards as mentioned by the above table 5.1, ward no 2 recorded the highest growth rate. It was alongside the G.T. Road and had an excellent location being the gateway to the Burnpur Road and the IISCO factory and also the entry point of the way to Kulti Iron Works and the Chittaranjan Locomotive Works. The administrative centre of the city- the court, treasury, and the police station were also in the neighbouring ward number 1 and 3. The built spaces for non basic activities like good schools were located in the nearby areas thus making the locality an attractive space for residential location even for the people who were employees in the industries of the neighbouring industrial-urban centres like Burnpur, Kulti and Chittaranjan.  People preferred to reside in wards like 2, 4 and 5.  The growth rate of ward no 1 and 3 were comparatively low as there were some areas which were not available for private use since they were under government jurisdiction. Ward number 5 also had land under rail authority’s control. Budha village, one of the oldest localities of Asansol was in Ward number 6. There were also large size of lands owned by Christian missionaries in wards 6 and 7. The comparatively lower population growth in these wards was due to non availability of land during this period for new settlement. Moreover, Ward number 7 was near the market area and the lowest growth rate suggests that the land was allotted for non residential business purposes.


We have noted earlier in the last chapter that during 1961-1971, the decadal growth rate was an impressive 50.83%. The rapid rise of residents in the city changed the structural composition of the wards. The existing wards were rapidly restructured and the number of wards increased from 7 to 25.
Table 5.2
Area & Number of Wards, Asansol Municipality, 1951-1971
Year
Area (in sq km)
Number of Wards
1951
10.44
7
1961
10.44
7
1971
10.44
25
Source: Census of India, District Census Handbook for Barddhaman 1951, 1961 and 1971.


This restructuring of Asansol was due to population hike in the city since 1961. Consequently the population of the first 7 wards of the reorganised Asansol Municipality had a steep fall as the following Table 5.3 shows. It depicts decadal growth rate of population in the erstwhile seven wards of 1961.  


Table 5.3
Ward Level Decadal Rate of Growth of Population in Asansol, 1961-1971
Ward Number
Decadal Rate of Growth of Population (%)
1
-54.01
2
-73.71
3
-60.70
4
-75.29
5
-86.42
6
-39.85
7
-69.10
Source: Computed from the data of Census of India, District Census Handbook for Barddhaman 1961 and 1971
The urbanisation of Asansol within the compass of its municipality was in fact vigorous and expansive. This can be best proved by its spill over effect on the neighbourhood of the municipality. The following maps 5.1 and 5.2 show how urbanisation was rapidly expanding itself with Asansol   municipality as its nucleus.
Map 5.1
Urban Area in Asansol, 1961


Source: Census of India, District Census Handbook for Barddhaman 1961


Map 5.2
Urban Area in Asansol, 1971


 Source: Census of India, District Census Handbook for Barddhaman 1971
The shaded parts show the total urban area.
The spatio- economic changes also led to the rise in urban growth during the next decade. Our next section analyses the emergent factors behind the urbanisation process in this period.


5.3 Spatial and Economic Changes in Asansol City during 1971-1991


The city turned bigger during these twenty years as shown by Table 5.4.


Table 5.4
Area & Number of Wards, Asansol Municipality, 1971-1991
Year
Area (in sq km)
Number of Wards
1971
10.44
25
1981
20.02
25
1991
25.02
30
 Source: Census of India, District Census Handbook for Barddhaman 1971, 1981 and 1991.


The area of the city increased significantly during the first decade of this study period. The wards became bigger in size. In the next decade, the number of wards also increased to thirty from twenty five with expansion of the area. The city was transforming from mono centric to multi centric one due to emergent features which came up during this period.


We have observed from the previous chapter that the seventies was the era of nationalisation of public sector industries like coal, steel and some other manufacturing units. Nationalisation of these industries gave a fillip to the overall development in the employment and urbanisation in this region. The rate of urbanisation here was 17.57% in the first decade and a significant 42.98% in the next decade.  


As mining and manufacturing industries played a dominant role for urbanisation, we are comparing the proportion of population engaged in mining and non household industries in the 25 wards of 1971 with those wards in 1991 . The following Table 5.5 depicts the locational pattern of the residents engaged in the mining sector in 1971 and 1991.
Table 5.5
Proportion of People in Mining Occupation (%), 1971 and 1991
Ward Number
Male ‘71
Male ‘91
Female ‘71
Female ‘91
1
5.49
12.43
4.41
3.85
2
2.49
6.04
1.72
2.60
3
1.91
4.86
0.00
0.47
4
1.53
1.54
2.50
0.00
5
2.11
3.37
3.77
4.58
6
1.29
5.52
2.00
2.61
7
2.03
2.95
2.08
2.92
8
0.10
1.40
0.00
0.48
9
0.27
4.01
3.45
3.39
10
0.46
2.71
0.00
1.27
11
0.96
0.74
0.00
0.00
12
0.92
0.51
0.00
0.00
13
0.92
0.39
0.00
0.00
14
2.76
1.94
0.00
1.89
15
2.33
1.84
4.00
0.00
16
3.17
3.32
1.72
1.15
17
27.33
1.71
41.38
1.18
18
0.79
2.10
0.00
0.00
19
2.33
3.18
0.00
1.32
20
0.63
14.65
0.00
9.06
21
1.00
3.43
0.00
2.70
22
0.46
0.79
0.00
0.43
23
0.80
0.89
0.00
3.48
24
0.15
3.61
0.00
2.22
25
0.44
1.97
3.45
2.56
Asansol MC
2.51
3.44
2.82
1.93
Source: Computed from the data of Census of India, District Census Handbook for Barddhaman 1971 and 1991.


The table 5.5 shows that during 1971-1991, more male population engaged in the mining activities started to reside in the city but the residential female population engaged in the mining sector diminished. The policy decision of the government adversely affected the female mining employment scenario.


The settlement pattern became more even in 1991 then in 1971. Excepting a single ward, ward number 13, every other ward contained male population engaged in mining occupation. The concentration of female workers in some wards also reduced during this period. Ward number 13 was the CBD area. The mining based working population naturally lived in the wards where there were service quarters for them or else they thronged in the wards where there was built in infrastructure for residence with schools and other likely amenities were near at hand. They were well connected by transport network and were either beside G.T. Road or its parallel S.B Gorai Road.


The above table shows that there were significant changes in the proportion of mining population in the wards 17 and 20. Whereas the first one revealed a notable reduction, the second one demonstrated a considerable increase.  Ward 17 was adjacent to the Central Business district and the other wards in the CBD like the ward numbers 13, 14, 15 and 16 also exhibited that either the population of the mining population remained constant or else waned. These wards thus have been transformed from residential to non residential urban space with scarcity of land for residential purposes. Moreover, the mining population here in the sixties i.e. in the pre nationalisation period were mainly semi skilled migrants from the neighbour states. They stayed together in a location. Ward 17 was one of those wards which give an idea about this social and cultural agglomeration.  However, from the eighties onwards, in the post nationalisation era, ECL suffered a set back which virtually reduced the in migration of semi skilled labours employed in coal industry here from other states (CDP, 2006). The mechanisation of production led to decrease of manual labour as revealed by the decrease of residents engaged in mining activities in some wards. In-migration decreased here (Socio Economic Report of ADPA, 1999-2000). Thus depopulation occurred. However, the built up area could not remain as an empty space. Thus gradually these wards were turned to non residential ones. The changes in the occupational structure as studied from these wards are evidences of that. Ward 20 was one of the peripheral wards at that time. Land was comparatively cheaper there than in the central locations. It was alongside the G.T. Road. A significant number of people employed in the mining activities were the residents of the Mohisila colony here. The location of a degree college and two higher secondary schools nearby also enhanced the preference of this ward for residential purpose.  Moreover, there were coal mines in the neighbouring areas and the adjacent town Jamuria was developing as a manufacturing centre. Thus people associated with the activities there also chose to reside here due to availability of urban amenities. The few wards which experienced a rise in female population engaged in mining activities were those where proportions of male mining population were also comparatively high. Thus it indicated the existence of social agglomeration of some sort in those areas.


The following Table 5.6 depicts the locational pattern of the residents engaged in the non household industries in 1971 and 1991.
Table 5.6
Proportion of People in Non-Household Industries in Asansol Municipality (%), 1971 & 1991
Ward Number
Male ‘71
Male ‘91
Female ‘71
Female ‘91
1
44.09
32.50
7.35
8.85
2
19.17
23.51
13.79
4.33
3
54.64
30.08
36.36
7.55
4
24.29
57.01
1.25
9.20
5
11.40
22.75
0.00
6.11
6
28.98
34.03
8.00
4.58
7
26.97
27.72
2.08
7.30
8
21.43
24.05
8.33
1.90
9
11.47
25.62
10.34
5.08
10
15.22
22.87
3.13
5.06
11
17.94
23.76
12.12
4.88
12
16.70
13.23
2.7
0.00
13
20.37
7.11
1.3
2.33
14
37.69
20.92
0.00
6.60
15
21.72
13.04
7.00
4.92
16
28.64
12.87
5.17
1.15
17
24.70
28.69
6.90
4.71
18
6.96
16.90
3.30
2.01
19
18.05
28.25
0.00
2.65
20
15.82
25.26
0.00
4.72
Ward Number
Male ‘71
Male ‘91
Female ‘71
Female ‘91
21
25.24
21.86
11.11
0.00
22
9.77
7.14
5.00
1.30
23
19.80
8.94
8.33
0.87
24
23.18
13.01
0.00
7.41
25
25.46
15.92
0.00
7.69
Asansol MC
22.79
22.28
6.15
4.45
Source: Computed from the data of Census of India, District Census Handbook for Barddhaman 1971 and 1991.


The Table 5.6 shows that though the proportion of residential population engaged in the non household industries reduced during this period. We have studied in the last chapter that since the ‘80’s, deceleration set in the large manufacturing and mining sectors. The recession in production affected both the public sector and the large private sector industrialisation jointly. Some large private sector manufacturing units became sick due to losing in market competition, the public sector suffered as they were compelled to nationalise some of these sick units. It was quite normal that the proportion of population who resided in some wards and employed in non household industries reduced.  However, some wards reflected an opposite trend. Proportion of people engaged in these industries increased in some of them. Male workers increased significantly in the wards like 8, 9, 11 and 17. Similarly, female workers increased significantly in the wards like 13, 14, 24 and 25. We have studied in chapter 4; there appeared a trend towards the proliferation of small scale manufacturing units in the city during this period. They were concentrated in some wards to gain the benefit of external economies of some sort.  For instance, productions of mining and machinery equipments were concentrated in wards like 17, 20, 21, 24 and 25. These wards experienced either rise in male or female employment or rise in both male and female employment. Wards like 24 and 25 had also small scale units producing exquisite garments and home décor to cater the high end market. Similarly factories producing electrical equipments were concentrated in the wards like 18, 19 and 20 especially in ward number 20. Among them, ward numbers 19 and 20 show significant rise of both male and female population employed in non household industries.  These were all parts of already developed Mohisila colony. We have mentioned earlier that these wards were also suitable for residential location due to availability of non basic activities in the neighbourhood. There were also automobile repairing units in ward number 20. Thus it shows that besides the city was turning multi centric with a number of sub centres having diverse economic activities.


Similarly, in the south western part of the city, ward number 4 and 5 attracted a considerable number of residential population engaged in the non household industries. There were more than one reason for this kind of urbanisation. For instance, land was available here during this period as the missionary schools which owned large tracts of land sold parts of them. The residential area Hill View developed in this way here.  Transport network started to develop through S. B Garai Road. Ward number 1 and 3 beside S. B Garai Road as mentioned earlier had land congenial for new urban growth as it already contained built space Court, Thana, Treasury Stadium, schools and college. Moreover, there were factories producing electrical equipments in ward number 1, 3 and 4. There was also automobile repairing unit in ward number 3. The availability of land with improvement in public transport network helped in the expansion of the neighbouring ward numbers 4 and 5. Markets for daily consumables grew up accordingly.


We have compared here the first 25 wards from 30 wards of the city in 1991. However, small non household industrial units were also started to growing in the peripheral wards like 29, 30 in 1991 due to expansion of road network like construction of NH2 Bypass.  A significant percentage of male population (15% to 23 %) engaged in the non household industries started to reside in these new wards. It proved that the city expanded in spatial size as land was not available or too expensive near the G.T. Road or the CBD area. The planned Kalyanpur housing estate area for middle income service groups was built in the 80’s in the north western periphery of the city in ward number 30. Public Transports in the form of new bus routes were started to develop in these newly urbanised areas. Another sub centre was developing there with the improvement in built infrastructure like road network, new schools and increase in public transport.  


The study of spatio- temporal changes made it clear that there were a number of emergent features behind the urbanisation of Asansol city. Moreover the study shows that improvement in transport network played a major role in the development of the sub centres.


5.4 Spatial and Economic Changes in Asansol city during 1991-2001


Asansol city turned bigger by five times during 1991-2001. The city expanded in spatial area and transformed into the highest local municipal body, the Municipal Corporation in 1994. The places which were added to the Asansol Municipality were the erstwhile Burnpur Notified Area Authority and the erstwhile Asansol CD Blocks. Map 5.3 shows the total area of Asansol Municipal Corporation in 2001.The shaded area was that of the erstwhile municipality.  


Map 5.3
Asansol Municipal Corporation
         Source: Introspection (2001), Asansol Municipal Corporation, Asansol
Besides the Burnpur Notified Area and some non municipal towns, a number of villages which were not part of the Asansol city in 1991 get amalgamated with the erstwhile municipality as new wards by administrative decision.
Table 5.7 informs us about the expansion of spatial area and the number of wards in the city during 1991-2001.


Table 5.7
Area & Number of Wards 1991 and 2001
Year
Area (in sq km)
Number of Wards
1991
25.02
30
2001
127.87
50
 Source: Census of India, District Census Handbook for Barddhaman 1991 and 2001.


The arrangements of the wards in the Asansol city is shown in the map 5.4 below.
Map 5.4
Map 5.5 shows the population density in all the fifty wards of Asansol Municipal Corporation in 2001.

Map 5.5
To see the pattern of urbanisation in the different wards, we compared the population density figures of the first thirty wards of Asansol Municipal Corporation with the erstwhile thirty wards of the former Municipality in the Fig 5.1 below.


Change in Population Density 1991-2001
Fig 5.1
Source: Computed from Census of India 1991, 2001.


The above graph shows that the population density reduced significantly in a large number of wards.


The change in the population density in the Asansol city, 1991-2001 is shown in the map 5.6 below.


Map 5.6
To find out the pattern of urbanisation in these wards, we look into the growth rate of population in these thirty wards from the Fig 5.2 below.


% Rate of Growth of Population 1991-2001
Fig 5.2
Source: Computed from Census of India 1991, 2001.


As the spatial area of these thirty wards did not change during 1991-2001, the above Fig 5.1 and Fig 5.2 depict the similar pattern.


However, as we have mentioned earlier that the overall population growth rate (unadjusted) of the city in 2001 was 81%. This was due to the role of the newly added areas. Thus to see the urbanisation pattern in the new wards, the Table 5.8 compares the population density of these places in 1991 with 2001.


Table 5.8
Population Density of the Newly Added Areas
Name of the  villages & Urban Area 1991
Population Density Per sq Km in 1991
Ward no in 2001
Population Density
Per sq Km in 2001
PALASHDIHA
13.73
31
1443
GOPALPUR
7.98
RAMJIBANPUR
8.81
RAGHUNATH BATI
13.30
SUDI
4.99
MARICH KATA
5.74
GOBIDAPUR
6.58
BANSARAKDI
12.14
SARAKDI NADIHA (NM)
823.05
GARUI
-
SARAKDI
-
NADIHA
-
HATGARUI
-
SHITALA
37.16
32
1625
MAHUJURI
10.42
BARAPUKURIYA
8.26
GARPARIA
15.02
UTTAR DHADKA
19.10
SAT PUKURIA
7.51
BAN BISNUPUR
14.61
KALLA (NM)
1790.77
NISCHINTA
9.02
33
1188
KESHABGANJ
7.03
CHAK KESHABGANJ
5.87
KANKHYA (NM)
2875.91
DAMRA
10.96
35
852
BURNPUR (NA)
2659.96
37
611
38
3637
39
23484
40
11795
Name of the  villages & Urban Area1991
Population Density Per sq Km in 1991
Ward no in 2001
Population Density
Per sq Km in 2001
BURNPUR (NA)
2659.96
41
21032
42
12654
43
6588
44
8177
45
847
46
12477
47
8096
46
2474
49
857
50
1729
Source:  Computed from the Census of India 1991 and Census of India 2001-Provisional Population Totals


The above table shows that in 1991 the population densities were high only in the non municipal towns and in the Burnpur Notified Area. Population density was very low in the villages when they were not part of the city. A wide disparity was noticed among the population densities of the village areas and the urban areas in 1991. When all these villages and urban areas became part of the city we see that population densities increased significantly in the new wards which incorporated these places. Thus though we are not finding the comparable growth rate of these places but looking into the rise of population density we can assume a considerably high rate of population growth here. This explains the high growth rate of Asansol Municipal Corporation as a whole to some extent.


The changes in the population density indicated the further development of sub centres. It appears that the city is becoming a multi centric one in 2001. There are many reasons for these changes in population density. We have discussed some of them in the earlier sections. However there were other socio-economic, demographic, geographical and historical factors which could affect population density pattern in a city. Moreover emergent factors with passage of time could influence the residential location decision. To study the impact of them on population density we are undertaking the regression analysis by considering the 1991-2001 data. For that, in the following sub section we are discussing the conceptual framework for choosing these variables followed by statistical analysis in the next subsection.


5.4.1 A Conceptual Outline and the Methodology


The intensity of land use in a city as mentioned above depends on a number of factors. The explanatory variables which assumed to have effect on population density of the wards and in turn shape the urbanization process of Asansol are:


  1. Orthogonal Distance of the wards from the Grand Trunk Road
  2. Radial Distance of the wards from the rail station area
  3. The square of the distance of the wards from the rail station
  4. The north- south dummy variable
  5. Work participation rate for male main worker
  6. Gender ratio
  7. Literacy rate of female population


We are summarising the reasons for selecting the above explanatory variables as follows:


In Asansol, the prevailing public transport mode during 1991-2001 consisted of buses, mini buses and rail transport. Rail network as the earlier chapter studied played an important role in the agglomeration economies of this region. However, as we have discussed in the earlier sections here that in the intra city equitable development, the availability of necessary road transport network was also equally important.  Therefore we have considered the orthogonal distance of the wards from the G.T. Road, radial distance of the wards from the rail station and the square of the distance of the wards from the rail station to examine the impact of physical accessibility on residential population density in the wards here.


Grand trunk Road divided the city into two parts. The larger southern part was more congested with a larger number of wards and higher average population density than the northern part. We are considering the north- south dummy variable to see whether any difference exists in the settlement pattern between the northern and the southern part of the city.


To analyse the impact of accessible transport on population density in the wards in the northern and the southern parts of the city, the following methodology is followed:


a) The wards are grouped according to their orthogonal distance from the Grand Trunk Road, in table 5.9.The wards located within average distance of 2 Kms from the Grand Trunk Road are either belong to or adjacent to the Central Business District. The wards at an average distance of 4 Kms and above are peripheral wards.
Table 5.9
Location and Distance of the Wards from the G.T road, 2001
Average Distance from Grand Trunk Road (in Kms )
Location / Ward Number
Number of Wards
North of G.T road
South of G.T Road
North
South
0.0 -2.0
2, 5, 21, 22, 23, 24, 25, 26, 27, 29, 30, 32, 33
1, 3, 4, 6, 7, 8, 9, 10, 11, 12, 13, 14, 15, 16, 17, 18, 19, 20, 34, 47, 50
13
21
2.1 – 4.0
28, 31
36, 38, 39, 40, 41, 42, 44, 48
2
8
4.1-5.2
-
35,37,43,45,46,49
-
6
Source: Computed from the Map of Asansol Municipal Corporation
b) The rail station and the adjacent business areas is our perceived city centre; it is ward 22, the ward which accommodates the rail station and at present the Central Bus Stand.  It is well connected with the rest of the city. To study the accessibility criteria, the distances of the wards from the city centre have been calculated. Concentric circles are drawn from the rail station taking the distance from one circle to another as 1 km. For instance, the radius of the innermost circle is 1 km, next is 2 km. They are grouped in Table 5.10 as follows.
Table 5.10
Location and Distance of the Wards from the Rail Station, 2001
Average Distance from the rail station (in Kms)
Ward Number
Total Number of wards
0.5
22, 23, parts of 17,19, 20,21,24 and 32
8
1.5
13,14,16,remaining parts of 19,20, 21, 24, 27 parts of 25, 26, 32 and 33
10
2.5
11, 12,15,Parts of 8,9,10, 18,25,26,28,29,32, 33 ,34 36 , 37 and 38
13
3.5
7,8, 28,Parts of 5, 6,9,32,33, 34,36,37and 38,
11
4.5
3,39,remaining parts of 5,6, 33,38, parts of 1,2,30,31,34, 35,36, 37 ,40 and 41,
16
5.5
4,40,41,42, parts of 2,1,30,31,32,34,35,37,42, 43 and 44
13
6.5
Parts of 1,2,35,31,37,44,45,47,48,45,46,47 and 48
13
7.5
Parts of 1,2,31,37,45,46, 47,48 and the beginning of 50
8
8.5
49,50,parts of 31 and 37
4
Source: Computed from Map of Asansol Municipal Corporation


The wards within the average distance of 2.5 Kms from rail station are adjacent to the city centre or some of them are parts of the CBD area. The wards which are at an average distance of 7.5 Kms from the rail station are in less accessible locations with respect to railway facilities.


The next component, the Main Work participation rate of male population is an indicator of the economic condition and thus expected to influence the population density in a space. Since Asansol is a built space consisting of basic and heavy industries besides coal mines and rail, the predominant workers are male. So we have chosen male main work participation rate for more detailed study.   


Theoretically, gender ratio is an indicator of the settlement pattern. As Asansol is a city which is known as the hub of the mining, industrial and trading centre, people resided here mainly for fulfilment of economic objectives. The study thus anticipates a negative relationship between the gender ratio and intensity of land use. Population density is high in those parts of this industrial city where the labourers and people connected to different business activities live. But that are not developed organised spaces to live with families.


Again, the bottom most explanatory variable, literacy rate of female population is also a measure of the settlement pattern because high female literacy rate is an indication of progressive society. Theoretically, literacy rate for female is negatively related to population density as it is high only in upper middle class areas where intensity of land use is comparatively low. From the regression analysis in the next sub section, we can know whether they are statistically significant or not.


All the relationships hypothesized here are tested in the next sub section in a regression framework.


5.4.2 Statistical Analysis


Regression analysis has been done by using SPSS software package to test the conceptual framework and for supporting the theoretical argument. To make the distribution more symmetric, logarithmic transformations have been done. We have checked the correlation matrix which shows very low levels of correlation between two or more predictors. So the problem of multi collinearity does not arise.


The data sets computed from the Census report of 1991 and 2001 are shown in the following Tables 5.11, 5.12 and 5.13.
Table 5.11
Report of Regression Analysis
Year 1991, No of wards – 30
Dependent variable (Y): log population density, 1991
Independent Variables
Regression coefficients
Radial Distance from rail station
2.418***
Square of the distance from rail station
-2.309***
Orthogonal Distance from G.T Road
-0.296*
Gender ratio
-0.548***
Work Participation Rate Male Main
-0.245
Female Literacy Rate
-0.052
North-South Dummy
0.395*
Adjusted R2 = 0.524     F = 5.568***


[For significant ‘t’s and F, * - for significant at 10%, ** for significant at 5% and *** for significant at 1% besides the values.]

As R2 is 0.524, the regression is a good fit. The overall regression model with all the independent variables included is statistically significant as F is statistically significant.


Table 5.12 and 5.13 are based on 2001 census report. Table 5.12 consists of the data set of the old thirty wards and not the newly added twenty wards for comparative analysis.


Table 5.12
Report of Regression Analysis
Year 2001, No of wards – 30
Dependent variable (Y): log population density, 2001
Independent Variables
Regression coefficients
Radial Distance from rail station
1.566**
Square of the distance from rail station
-1.301**
Orthogonal Distance from G.T Road
-0.494***
Gender ratio
-0.345*
Work Participation Rate Male Main
-0.261
Female Literacy Rate
-0.110
North-South Dummy
0.322*
Adjusted R2 = 0.378, F = 3.519***


Here R2 is 0.378 so the regression is a moderate fit.
Table 5.13 shows the regression calculated from the set of population data of 50 wards of Asansol Municipal Corporation in 2001.
Table 5.13
Report of Regression Analysis
Year 2001, No of wards – 50
Dependent variable (Y): log population density, 2001
Independent Variables
Regression coefficients
Radial Distance from rail station
0.934**
Square of the distance from rail station
-1.025***
Orthogonal Distance from G.T Road
-0.336**
Gender ratio
-0.239**
Work Participation Rate Male Main
-0.083
Female Literacy Rate
0.620***
North-South Dummy
0.027
Adjusted R2 = 0.614    F = 12.124***
Since R2 is 0.614 here, the regression is a good fit.


We summarise the main findings below and sorting out the inconsistencies since the test of hypothesis does not match with the conceptual understanding in some cases.


The above tables show that the explanatory variables denoting physical accessibility are the most important link with population density. This confirms that the intensity of land use and physical accessibility in the form of built infrastructure transport network go together. Physical accessibilities from the CBD area as measured by the radial distance from rail station and the square of the distance from the rail station emerge as statistically significant explanatory variables in both 1991 and 2001. Residential population density was low near the rail station i.e. the CBD area as expected. It was more profitable to use land there for non residential business activities. Moreover, adjacent to the rail station there were built spaces owned by railway authority for administrative set up and service quarters. As land was scarce there, naturally the rent and price was expected to be very high and individuals had to stay at a distance from the rail station. The city expanded accordingly, transport network evolved and sub centres were created to cater the various needs of the residential population. Again, the radial distance from the rail station emerges as a stronger statistically significant explanatory variable when the observation was based on erstwhile 30 wards instead of the 50 wards in 2001. This is because the newly added wards were at a greater radial distance from the rail station. Some of these wards were agricultural and mining areas which needed more land for production activities. Thus residential population density was lesser than the erstwhile thirty wards.


Transport facilities were not developed in the fringe areas. So population density was low there in 1991. When the city expanded spatially in 2001, the relation followed the same pattern because the development of public transport network was not uniform in these areas.


The orthogonal distance from G.T. Road emerges as a statistically significant variable at 10% level of significance in 1991. It emerges as more significant when we consider the old 30 wards of AMC in 2001. It also contributed significantly to the population density changes when the study considers all the fifty wards in 2001.  


As mentioned earlier the expansion of the city over time was along the two sides of the G.T. Road. There was lack of adequate built infrastructural development in road and transport network in the areas away from the G.T. Road. Thus population density was high near the G.T. Road in 1991. During the decade 1991-2001, infrastructural development in road construction and public transport network expanded in some other areas of the old city. The automobile ownership of the residents also increased than in the earlier decades as it became easier to commute by motorised transport. We have also mentioned earlier that sub centres have evolved in these wards. But, as we have mentioned earlier, the spatio- economic characteristics of the newly added twenty wards were different from the erstwhile wards. G.T. Road was lifeline for the population there as rail station was far away and CBD is adjacent to the rail station. Moreover most of these new wards lacked the non basic activities like educational institute and health infrastructure for which they needed the G.T. Road to avail themselves of these facilities. Thus distance from the G.T. Road is statistically significant in all the analysis.  


Gender ratio as anticipated is statistically significant in all the statistical analysis. However, it emerges as a stronger variable in 1991 than in 2001. This is because the city expanded vertically during this decade in the majority of the old thirty wards where there were advantages of non basic activities. Thus more people can reside with family in the same area in 2001 than in 1991. Thus the explanatory variable gender ratio becomes a significant predictor for population density changes only at 10% level of significance. However, it contributed significantly to the population density changes at 5% level of significance when we consider all the fifty wards. We have already mentioned that the spatio economic character of the newly added wards was different from the old wards. Vertical space in the form of multi storied apartment was not developed there because a large part of the land there was owned by IISCO and ECL authorities. There were residential family quarters for the middle and high income earners where intensity of space uses were considerably high.  Besides some wards were tribal inhabited areas with few urban amenities.  


the work participation rate of male main workers is not statistically significant in all the above three tables . Thus, in Asansol, the residential location decision was not determined by the number of workers in the localities in 1991 and 2001.


Female literacy emerges as a statistically significant predictor for population density changes only in 2001 where we consider all the fifty wards. The upper middle and high income earners whose female literacy rate was high shifted from the old city to the new areas. Lands were available there and these people could enjoy more space in these areas. Moreover, female literacy was comparatively high due to incorporation of the Burnpur Notified Area as it was the residential area of the middle and higher income population employed in the public sector steel industry.


In 1991, the North -South dummy variable contributed significantly to the population density changes. In the northern part there were lands owned by the railway authority. The rail station was in the northern part. There were some of the oldest parts of the Asansol town where poor minority communities live from earlier days. There were also mining areas where there were restrictions on private ownership of land. Moreover the northern part lacked the built infrastructural facility and NH-2 Bypass was not constructed then. For these reasons, residential population density was higher in the southern part and thus north- south dummy variable emerges as a statistically significant predictor for population density changes. When we consider the old thirty wards of the city, the north-south dummy variable again emerges as a significant predictor for population density changes. The construction of NH-2 did not change the population density variation in the two parts of the G.T. road. This is because most of these thirty wards were away from the new Bypass. Sub centres in these wards also grew in the southern part of the G.T. Road.  However, the north south dummy variable is not significant when we consider all the fifty wards in 2001. The industries and the mining sector were passing through a slump in the decade 1991-2001, Asansol being a reputed trade and transport centre, people pressed upon the G.T Road both in the north and south. With the expansion of the city along either side of the G.T. Road both in the north and the south, the habitation along the G.T. Road also expanded. The new wards in the north are adjacent to the NH-2 Bypass. The development of the transport network here led to rise in population density in both parts. Moreover, as land was scarce or the rent was high in the southern part where urban infrastructure was more developed, people settle in the northern part near the G.T. Road. The new Satellite Township was constructed in the northern part. Sub centres grew up in the newly added areas due to the creation of built space like schools, engineering college and hotels. Moreover some of these activities which were in the erstwhile municipality areas along the G.T. Road earlier shifted their activities in the northern part of the newly added areas beside the By Pass.  For instance a reputed school in the city relocated their activities beside the Bypass here. As the school became large with more students, it needed more space which was not possible where it was located earlier due to scarcity of land. So it shifted to the new location because of the availability of required land.  It gradually emerges as a new sub centre with increasing residential population density adjacent to it.

5.5 Conclusion


Thus along the passage of time, the rate of urbanisation increased and sub centres started to evolve depending on external economies. A social agglomeration tendency was also noticed in some places. The empirical findings reveal that residential location patterns in the different wards of the Asansol city is more influenced by the formation and evolution of built infrastructure which again is a complex co ordination of a number of factors as we have studied.


In the next chapter, the concluding one we will sum up what we have realised from the study and would raise some relevant issues regarding spatio- economic planning in Asansol.


Plates of Asansol City


Plate 5.1: Asansol Railway Station

Picture


Plate 5.2: Gateway to Asansol Municipal Corporation Area

Picture 003


Plate 5.3: Grand Trunk Road
Plate 5.4: Kushadanga Incline, Ward 33

Picture 004


Plate 5.5: Factory under Lockout


Picture 014


Plate 5.6: Labour Colony of a Coal Mine
Appendix to Chapter 5


Appendix Table 5.1
The Area and Total Population of the Villages and Urban Areas in 1991 Which Became Part of the Asansol City in 2001
Name of the  villages & Urban Area, 1991
Ward No In 2001
Area per sq km in 1991
Population in 1991
GARUI
31
-
1135
PALASHDIHA
50.97
700
SARAKDI
-
925
NADIHA
-
1008
GOPALPUR
67.57
539
HATGARUI
-
362
RAMJIBANPUR
90.22
795
RAGHUNATH BATI
85.54
1138
SUDI
192.49
960
MARICH KATA
159.87
917
GOBIDAPUR
164.86
1085
BANSARAKDI
77.59
942
SARAKDI NADIHA (NM)
5.90
4856
SHITALA
32
45.53
1692
MAHUJURI
78.04
813
BARAPUKURIYA
161.20
1331
GARPARIA
171.64
2577
UTTAR DHADKA
91.24
1743
SAT PUKURIA
181.33
1362
BAN BISNUPUR
65.28
954
KALLA (NM)
2.60
4656
NISCHINTA
33
398.39
3592
KESHABGANJ
60.14
423
CHAK KESHABGANJ
69.79
410
KANKHYA (NM)
1.37
3940
DAMRA
35
344.65
3779
BURNPUR (NA)
37-50
65.79
174933
Source: Census of India 2001-Provisional Population Totals, Census of India 1991


Appendix Table 5.2
Location of the wards and their Average Population Density in North/ South part of the G.T Road in Asansol, 2001
Location(North/South)
Ward Number
Total Number of Wards
Average Population Density
North of G. T. Road
2 , 5, 21, 22, 23, 24, 25, 26, 27, 28, 29, 30, 31, 32, 33
15
8688
South of G. T. Road
1, 3, 4, 6, 7,8, 9,10, 11, 12, 13, 14, 15, 16, 17, 18, 19, 20, 34-50
35
13740
Source: Asansol Municipal Corporation
Appendix Table 5.3
Data Set for Regression Analysis, 1991 and 2001


WARD NO
N (0) - S (1)
OF GT RD
DIST FROM RAIL STN (KM)
DIST FROM G.T ROAD (KM)
POPULATION DENSITY
GENDER RATIO
FEMALE LITERACY RATE
MALE MAIN WPR
‘91
‘01
‘91
‘01
‘91
‘01
‘91
‘01
1
1
6.64
0.66
4955
5211
833
964
77.7
84.8
49.8
49.1
2
0
6.00
0.55
5977
6670
853
933
61.1
83.5
47.2
49.7
3
1
4.73
1.60
24409
22546
804
900
80.5
88.4
47.4
45.0
4
1
5.00
0.28
66321
60926
806
877
72.9
80.8
39.4
39.6
5
0
4.00
0.28
13043
12437
862
978
79.7
83.0
43.8
50.4
6
1
4.00
0.55
7871
8263
914
925
76.8
90.0
39.7
44.2
7
1
3.45
0.99
13302
13456
879
899
72.4
81.9
38.1
48.5
8
1
3.00
0.28
62737
52554
868
896
74.0
77.8
45.0
44.4
9
1
4.00
2.09
6735
9796
870
933
76.7
83.4
49.0
44.8
10
1
2.55
1.10
17292
17175
868
934
82.8
88.0
49.1
48.4
11
1
2.64
0.44
11702
14634
801
908
85.1
86.8
49.9
42.5
12
1
2.36
0.17
43128
29359
841
885
77.5
88.9
49.7
47.6
13
1
2.00
0.17
32796
18920
705
859
75.0
87.7
58.2
54.3
14
1
1.73
0.55
32105
24573
737
916
81.1
87.0
58.4
55.6
15
1
2.00
0.55
34677
28328
771
821
75.8
84.2
49.8
49.6
16
1
1.73
1.10
8388
8283
827
926
74.9
80.2
52.5
53.3
17
1
1.00
0.22
26017
26291
814
896
74.2
83.5
48.9
49.4
18
1
2.45
1.87
5119
7219
938
953
74.1
83.4
49.9
49.6
19
1
1.00
0.66
8623
8865
846
920
66.3
80.5
52.2
48.6
20
1
1.36
0.55
6110
5869
873
899
68.1
79.0
46.8
46.4
21
0
0.70
0.28
5041
5677
735
895
74.8
85.2
46.8
47.6
22
0
0.00
0.44
5448
4945
720
862
59.8
72.8
47.9
48.3
23
0
1.00
1.21
4684
5156
818
849
67.6
69.2
38.0
39.6
24
0
1.45
1.27
4498
5160
836
906
72.1
74.4
44.7
42.4
25
0
2.36
2.26
10781
13528
813
833
58.9
72.2
43.1
42.4
WARD NO
N (0) - S (1)
OF GT RD
DIST FROM RAIL STN (KM)
DIST FROM G.T ROAD (KM)
POPULATION DENSITY
GENDER RATIO
FEMALE LITERACY RATE
MALE MAIN WPR
‘91
‘01
‘91
‘01
‘91
‘01
‘91
‘01
26
0
2.00
0.77
9297
8058
753
865
56.1
75.9
47.6
47.8
27
0
3.00
0.55
34764
29024
832
910
75.3
80.8
40.3
40.9
28
0
3.45
2.48
19600
22564
870
899
49.7
65.9
37.3
36.7
29
0
4.00
1.54
10255
8612
845
922
56.2
65.1
38.2
36.7
30
0
5.45
2.42
3533
4247
873
924
85.1
87.0
47.2
42.1
31
0
8.00
2.75
-
1443
-
907
-
59.5
-
34.0
32
0
2.00
1.49
-
1625
-
921
-
49.0
-
29.9
33
0
2.45
1.93
-
1188
-
913
-
54.3
-
27.6
34
1
4.00
1.38
-
2041
-
848
-
44.5
-
33.7
35
1
5.00
4.51
-
852
-
906
-
55.6
-
36.5
36
1
3.00
2.97
-
1290
-
865
-
52.7
-
31.3
37
1
5.36
5.34
-
611
-
903
-
41.1
-
31.5
38
1
4.00
3.91
-
3637
-
898
-
69.7
-
33.1
39
1
4.82
2.42
-
23484
-
881
-
73.6
-
34.3
40
1
5.82
2.86
-
11795
-
859
-
65.5
-
36.1
41
1
5.00
3.41
-
21032
-
904
-
88.8
-
43.8
42
1
5.18
4.29
-
12654
-
837
-
86.5
-
46.5
43
1
5.73
5.45
-
6588
-
887
-
73.8
-
37.5
44
1
6.00
4.02
-
8177
-
882
-
85.7
-
43.1
45
1
7.00
5.78
-
847
-
906
-
73.1
-
33.3
46
1
7.45
5.23
-
12477
-
901
-
69.7
-
38.1
47
1
7.00
1.49
-
8096
-
820
-
67.5
-
40.4
48
1
7.45
3.41
-
2474
-
843
-
81.0
-
43.7
49
1
9.45
5.56
-
857
-
886
-
59.2
-
30.3
50
1
9.00
1.65
-
1729
-
887
-
63.8
-
34.7
Source: Computed from the data of District Census Handbook Census of India 1991,Census of India 2001 and Ward Map of Asansol Municipal Corporation